B2B Loyalty Program ROI: How to Calculate It (With Real Benchmarks)
The ROI of a B2B loyalty program is one of those things that feels like it should be straightforward, and then isn't, the moment you actually try to calculate it.
If the formula is simple, the inputs aren't. Particularly in B2B, where your transaction data often sits with a distributor rather than with you, isolating what the program actually caused (versus what would have happened anyway) requires more rigour than most business cases apply. Here's how to do it properly.
The short answer: B2B loyalty program ROI = ((Incremental Profit − Program Cost) ÷ Program Cost) × 100. Research consistently shows 90% of loyalty programs generate positive ROI, with well-run programs returning 2-4× in Years 2-3.
The hard part is isolating incremental revenue when you sell through a channel. This post shows you how, step by step.
Calculate your own ROI in under 2 minutes →
Why B2B loyalty program ROI is harder to calculate than B2C
The formula is simple, the problem is the inputs.
In B2C, you compare thousands of loyalty members against thousands of non-members, while in B2B, your customer base might be 50 accounts or 500.
Every account matters individually, control groups are hard to construct cleanly, and for manufacturers selling through distributors, the transaction data you need to calculate ROI often sits with your channel partner, not with you.
According to White Label Loyalty's 2026 Marketing Lag research, 72% of B2B manufacturers say they own first-party customer data, but only 9.7% can activate it in real time.
You cannot calculate ROI from data you cannot access: this is why a well-integrated loyalty platform is often as much a data infrastructure decision as a marketing one.
Step 1: Define what "incremental revenue" means for your program
Before running any numbers, decide what your program is designed to change. B2B loyalty programs typically move one or more of these revenue levers:
- Purchase frequency: How often does a trade customer or channel partner buy from you? A distributor moving from quarterly to monthly ordering is a significant revenue shift at account level.
- Average order value (AOV): Are enrolled partners spending more per order? Tier thresholds, volume rebates, and new SKU adoption rewards are the usual drivers. Well-designed B2B programs with tier-based volume incentives regularly produce 20–35% AOV lift among actively engaged partners.
- Product mix: Are partners moving toward higher-margin product lines, or just buying more of the same SKUs?
- Retention: Are enrolled partners churning less? Bain & Company research shows a 5% improvement in customer retention can increase profits by 25–95%. In B2B, where a single account can represent hundreds of thousands in annual revenue, even modest retention gains produce outsized financial impact. Retention ROI compounds significantly over a 3-5 year horizon.
- Advocacy and referrals: Are partners actively recommending you to end customers or new accounts? This revenue is real but requires tracking mechanisms (referral codes, attributed deals) to capture.
Your ROI model should focus on the one or two levers your program is primarily designed to move. Attributing everything at once produces noise, not a defensible business case.
Step 2: Establish your baseline
Incremental revenue only means something relative to a baseline. You need a pre-program reference point for each metric, ideally 12 months of historical data per account.
Three baseline approaches, in order of reliability:
- Control group (gold standard): A matched set of eligible but non-enrolled accounts. Compare enrolled vs. non-enrolled behaviour over the same post-launch period. Eliminates most external confounders.
- Pre/post comparison: The same accounts, 12 months before launch vs. 12 months after. Simpler to set up, but vulnerable to market shifts, seasonal variation, or competitive changes during the measurement window.
- Benchmark comparison: Use published industry benchmarks as a proxy baseline when you lack internal historical data. Least rigorous, but usable for pre-launch business-case modelling. See the benchmark table in Step 4.
Step 3: Calculate total program costs
The denominator in your ROI formula needs to capture every real cost, not just platform licensing. B2B programs consistently undercount costs at the business-case stage, which produces inflated projected ROI and credibility problems at first review.
- Technology: Platform licensing fees, setup and integration costs (ERP, CRM, POS), and ongoing development.
- Rewards liability: Cashback, rebates, merchandise, co-marketing funds, travel incentives, exclusive pricing. Model this against your expected redemption rate, not face value of points issued. Unredeemed points (breakage) reduce your actual cost: typically 20-40% of issued rewards go unredeemed in well-run B2B programs.
- Operations: Staff time managing the program, reviewing claims, running communications, and handling partner queries. This is the most consistently underestimated cost in B2B, where account-level management is more intensive than B2C.
- Marketing and communications: Partner onboarding, activation campaigns, ongoing engagement, and any channel promotion.
- Data and measurement: Analytics tooling, reporting, and research costs.
A realistic operational cost for a mid-market B2B program (200-1,000 trade accounts) runs 1-3% of total enrolled partner revenue annually once fully operational. Year 1 is higher due to setup and integration investment: factor this into your payback period modelling.
Step 4: Apply the formula, worked example
Here's a realistic model for a manufacturer with 400 trade accounts (installers and contractors) across the UK and US:
Input | Value |
| Total trade accounts | 400 |
| Average annual spend per account (pre-program) | £/$ 12,000 |
| Total baseline revenue | £/$ 4,800,000 |
| Enrolled accounts (60% participation) | 240 |
| Spend uplift for enrolled accounts | +18% |
| Incremental revenue from enrolled accounts | £/$ 518,400 |
| Gross margin | 38% |
| Incremental gross profit | £/$ 196,992 |
| Total program cost (Year 1, incl. setup) | £/$ 95,000 |
| ROI - Year 1 | 107% |
| ROI - Year 2 (setup costs removed, 75% participation) | ~240% |
Year 1 ROI is positive here, but this is a mid-range outcome. Programs with higher setup costs or slower partner adoption may be near breakeven in Year 1, which is normal and expected.
The industry benchmark of 2:1 to 4:1 ROI refers to a mature program in Years 2-3: build your business case with a three-year view.
Real B2B loyalty program benchmarks
Use these figures as reference points when modelling projected ROI or benchmarking a live program's performance:
Metric | Benchmark | Source | Notes |
| Loyalty programs generating positive ROI | 90% | Rivo, citing Digital Silk, 2026 | Across B2B and B2C programs that formally measure ROI |
| Average revenue return vs. program cost | 4.8× | Rivo / Queue-it, 2026 | Weighted average including underperforming implementations; top quartile significantly higher |
| B2B loyalty programs increasing customer LTV | 79% | Rivo, 2026 | LTV improvement among active B2B loyalty members |
| Profit impact of a 5% retention improvement | +25–95% | Bain & Company | Original Bain research; widely validated across industries |
| B2B loyalty programs increasing referrals | 80% | Rivo, 2026 | Among programs with structured referral mechanics |
| Revenue lift: members vs. non-members (annual) | 12–18% | Brandmovers / Visu Network, 2026 | Well-structured programs, actively promoted |
| B2B loyalty market CAGR through 2030 | 15–18% | Multiple market research sources, 2025–26 | Range reflects different methodologies across Grand View Research, MarketsandMarkets |
| B2B manufacturers able to activate customer data in real time | 9.7% | WLL Marketing Lag Report, 2026 | Original WLL research: survey of 200+ B2B manufacturers across UK, Europe, US |
Two figures here deserve particular attention for B2B ROI modelling. The 4.8× average return is a weighted mean that includes poorly-run programs, well-designed B2B programs consistently outperform it.
And the 9.7% real-time data activation figure points to something the ROI spreadsheet alone won't show: if you're currently making channel decisions based on lagged or incomplete distributor data, a loyalty program closes an information gap that is already costing you revenue you cannot currently measure.

What good looks like: ARDEX/BAL
ARDEX Group UK, a global manufacturer of premium flooring and tiling products, illustrates what this looks like at program level.
ARDEX sold through a complex UK distribution network with almost no direct visibility into who was buying their products, how often, or why. They faced a structural pricing problem: premium products, price-sensitive customers, and no direct relationship with the installers and contractors making the purchasing decision.
Working with White Label Loyalty, ARDEX built GivBax Rewards: a digital loyalty program rewarding installers and contractors for purchases of ARDEX and BAL products from any UK distributor, using receipt scanning technology. Members upload any purchase invoice (physical or digital), the platform verifies the products, and the reward is issued automatically.
Results within 6 months:
Metric | Result |
| Engagement rate among enrolled members | 73% |
| Addressable market acquired | 17% |
| ARDEX UK sales flowing through the program | 8.8% |
| Increase in average spend per user transaction | +10% |
Before GivBax, ARDEX had fragmented data, no direct customer relationships, and no structural answer to lower-priced competition. After: real-time purchase visibility, a direct channel to end customers, and a measurable commercial return achieved not through discounting, but through making the relationship more valuable than the price gap.
Read the full ARDEX case study →
The metrics your CFO will ask for
The headline ROI figure alone rarely secures budget approval in B2B. Finance teams ask for:
- Payback period: When does cumulative incremental profit exceed cumulative program investment? For most B2B programs, 12-24 months. Model it year by year, not as an average.
- Incremental profit, not revenue: Always present returns in gross profit terms. A £500k revenue uplift at 35% margin is a £175k profit contribution. Present profit.
- Attribution fraction: What percentage of observed uplift can you directly attribute to the program? A conservative attribution (50-70% of measured uplift) is more credible than claiming 100%, and still typically produces strong ROI.
- Sensitivity analysis: Model ROI at 50%, 75%, and 100% of projected participation and spend uplift. A business case that holds at 50% of target is one that survives a difficult review.
- Cost of inaction: The ROI calculation shows only one side. The other side is what it costs to not invest: continued channel data blindness, ongoing partner churn, and revenue going to competitors who are already running structured incentive programs. A single lost mid-tier account per year often exceeds the total annual running cost of a program.
How B2B loyalty ROI differs from B2C
A few structural differences worth building into your model:
Longer timescales. B2B purchasing cycles run 12-24 months. ROI accumulates more slowly but compounds more powerfully because retention lifts are larger and account values are higher.
Non-purchase behaviours drive real value. Training completions, certifications, referrals, and data-sharing agreements all generate commercial outcomes, but won't appear in a simple spend-uplift ROI model. The best B2B programs reward these behaviours and measure their impact separately.
Account-level measurement. One distributor account may involve multiple individuals earning points. Track spend at account level, not by individual redemption.
Richer data, harder attribution. Fewer accounts means every data point carries more weight. A platform integrated with your ERP or CRM gives you account-level purchase history, engagement data, and redemption behaviour in one view, the foundation of a credible ongoing ROI measurement process.
Calculate your B2B loyalty program ROI
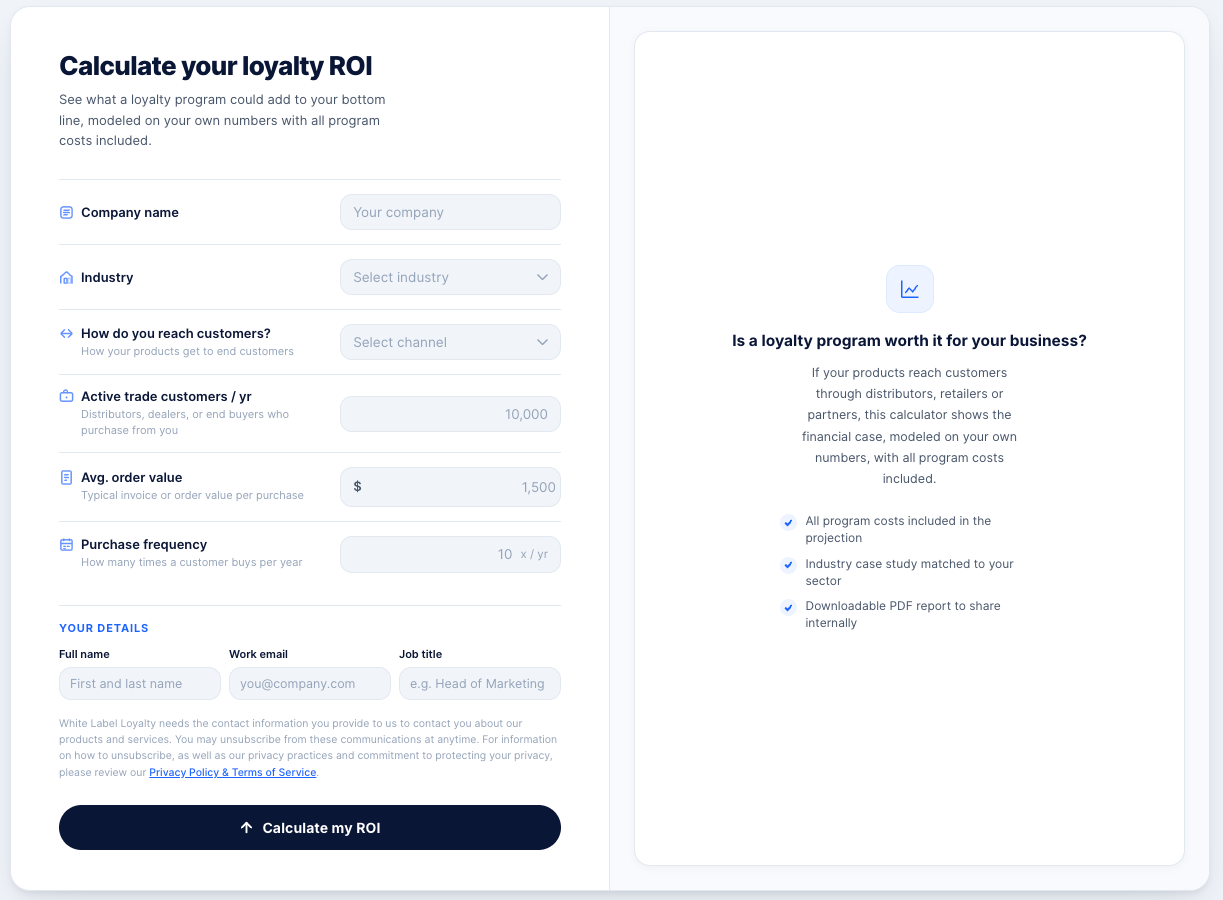
The White Label Loyalty B2B ROI Calculator applies this framework to your actual trade customer numbers, with all program costs included, and returns an instant net profit estimate.
It's free, takes under two minutes, and produces a number you can take into a budget conversation the same day.
Calculate your Loyalty ROI. Or if you'd prefer to talk through the numbers with a loyalty specialist: Book a demo!
Frequently Asked Questions (FAQs)
Recommended Posts
If you enjoyed this article, check out these relevant posts below.
Share this Article

Sara Rabolini
Senior Content Marketing Executive
Sara is our Senior Content Marketing Executive. She shares engaging and informative content, helping businesses stay up-to-date with the latest trends and best practices in loyalty.